
Thairo and I went over to the island for the past 2 days. I hung out in a dark room watching presentations from a chunk of people that work on the same transect. It was really interesting and I learned tons. I also found that we really are doing something new, working on the bacteria and archaea. And I have to say, contour plots are cool.
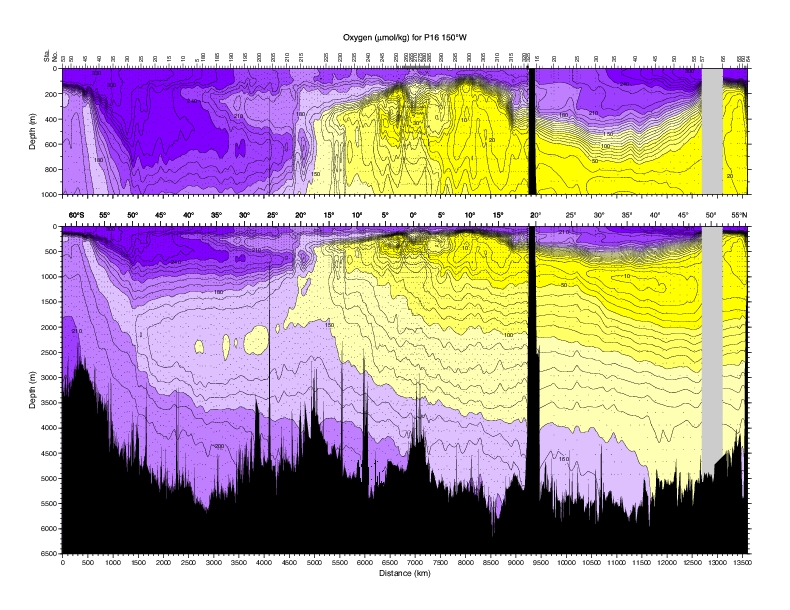
Here's a nice one showing oxygen in the Pacific. The y axis is depth. x is latitude so south on the left, north on the right. Yellow is low oxygen and blue is high oxygen. Pretty graph.
Subscribe to:
Post Comments (Atom)


No comments:
Post a Comment